Concepts/Concept
Observability: A Swiss Mechanical Watch Under a Glass Dome
From the Dongfang Yiteng execution agent (case by Bo Liang)

Definition
A single conversation with an execution-type agent sits on top of a long string of invisible actions: recognizing intent, routing branches, chained reasoning, calling tools, reading and writing state, synthesizing a reply. If the developer can see only two layers — the user input and the final reply — and everything in between is a black box, then every time the system goes wrong, locating the fault comes down to guessing. Observability is what addresses this: it exposes every action the agent takes, and the thinking that drives each action, to the developer along a complete timeline.
The word "observable" here carries a sense that should be made clear first. It does not refer to the agent's perception of the world it inhabits, but the reverse — making the agent's consciousness and behavior visible to the developer. The series of actions an agent produces within a conversation is its bodily activity; the reasoning and judgment that drive those actions are its mental activity. Observability lays both of them out to be seen.
How it works
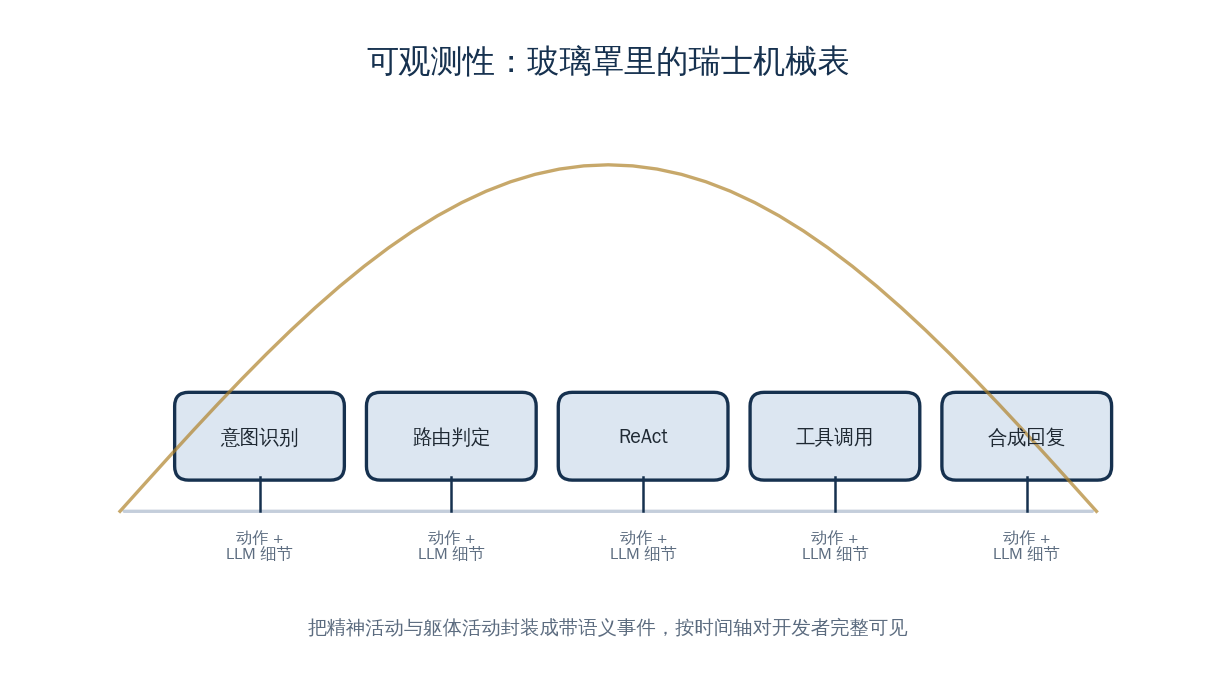
The glass dome metaphor comes in right here. Once the development mode turns on the full set of observable events, assembling this intricate and precise agent feels close to repairing a Swiss mechanical watch inside a transparent glass dome. A mechanical watch has many parts that mesh precisely, but as long as the dome is transparent, you can see where each gear is turning and which hairspring is moving. The agent is the same: what the intent-recognition step identified, which downstream chain the intent gateway routed it to, how far the ReAct loop has run, what prompt the LLM call at this step used, what the model returned, how much it cost — all laid out in order along the timeline. The more complex the system, the more this transparent dome eases the developer's cognitive load. It does not reduce the system's own complexity, but it makes that complexity visible and inspectable.
The failures it guards against are concrete. An execution-type agent has long chains and many stages; once a delivery falls short of expectations, the problem may lie in a misjudged intent recognition, in a reasoning step that veered off, or in the argument binding of a single tool call. Without a timeline, the developer can only replay the whole conversation again and again to guess which stage went wrong, and the debugging cycle stretches out. Lay out every step's action and the LLM call's details along the timeline, and locating the fault shifts from guessing to looking — which step's output does not match expectation lands on that one cell at a glance.
Dongfang Yiteng placed this lesson at the starting stage, rather than waiting until the system grew complex to add it. The project started by wiring up the most basic conversation pipeline, and the first piece of infrastructure it did in earnest was observability. The approach is to wrap and abstract the agent's activity and the program logic uniformly into events that carry semantics — user intent recognition, intent gateway routing decisions, and ReAct execution are all such events — and then to present the whole execution process of a conversation clearly along a timeline. At each step you can see both what action the agent produced and, in time order, the LLM call details for that step: the prompt actually used at runtime, the model's output, and the various costs associated with that step. These debugging details can be turned off in production and turned on in the front end during development. Once the foundation is laid, the system stacks intent recognition, reasoning, and action capabilities on top step by step, and with each layer you can directly see how it works inside the dome.
When you need it
When a single conversation with your agent has to run multiple steps across multiple capability stages, and each step may go wrong. The more stages and the longer the chain, the greater the return on laying the execution process out as a transparent timeline in development mode. What this timeline presents is the string of activity events that the Orchestrator arranges at runtime.
This is an ADPS blue-book concept. Back to Concepts or the pattern matrix.